
Digital Resilience Pays Off
Download this e-book to learn about the role of Digital Resilience across enterprises.
I’ve always wanted a way to integrate Splunk machine data with actual diagrams of our network. The idea is to reproduce the look and feel of a computerized system control panel. In the control panel, icons represent components of the system, and as the state these components change, aspects of the diagram change to reflect their significance (icons turn green, red, etc):
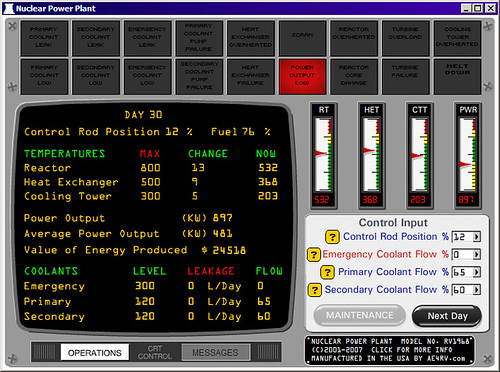
Here’s a screen capture of my attempt to create something like this for Splunk.
I call it a ‘Real time Machine Diagram’:

Using a Real-time search, this diagram dynamically shades icons representing machines on network. As the error rate of a machine increases (the number of errors coming across in logs increases) the icons turn intensely red; as the error rate decreases, as does the intensity of the red.
This was written using:
In Part 2 I’ll discuss the magic. Stay tuned!
----------------------------------------------------
Thanks!
Greg Albrecht

The Splunk platform removes the barriers between data and action, empowering observability, IT and security teams to ensure their organizations are secure, resilient and innovative.
Founded in 2003, Splunk is a global company — with over 7,500 employees, Splunkers have received over 1,020 patents to date and availability in 21 regions around the world — and offers an open, extensible data platform that supports shared data across any environment so that all teams in an organization can get end-to-end visibility, with context, for every interaction and business process. Build a strong data foundation with Splunk.

Get the latest articles from Splunk straight to your inbox.
© 2005 - 2024 Splunk Inc. All rights reserved.
